Energy & Utilities
Energy & Utilities
Energy & Utilities
AI that keeps watch over your plants and substations, with every reading on one screen your team can act on.
AI that keeps watch over your plants and substations, with every reading on one screen your team can act on.
AI that keeps watch over your plants and substations, with every reading on one screen your team can act on.

THE DAY TO DAY CHALLENGES
THE DAY TO DAY CHALLENGES
THE DAY TO DAY CHALLENGES
Keeping the power on takes more than power.
Keeping the power on takes more than power.
Keeping the power on takes more than power.
Power plants and utilities run assets spread across large sites, and many of them never stop. They already collect plenty of sensor data. The hard part is turning it into something the team can act on before trouble starts.
Power plants and utilities run assets spread across large sites, and many of them never stop. They already collect plenty of sensor data. The hard part is turning it into something the team can act on before trouble starts.
Power plants and utilities run assets spread across large sites, and many of them never stop. They already collect plenty of sensor data. The hard part is turning it into something the team can act on before trouble starts.
Surprise Outages
Turbines and pumps show early signs of trouble that go unnoticed until it's too late.

Coal Belt Stoppages
A torn coal belt can starve the boilers, and output drops before anyone knows why.

Too Many Screens
Hundreds of sensor readings sit in separate control rooms that nobody sees together.

Safety Slips
Hard hats get skipped and people walk into high-voltage areas without anyone seeing.

Remote Assets
Far-off substations need regular checks, and sending people out every time costs a lot.

Compliance Reports
Emissions and compliance reports get built by hand from logs, month after month.

Surprise Outages
Turbines and pumps show early signs of trouble that go unnoticed until it's too late.
Coal Belt Stoppages
A torn coal belt can starve the boilers, and output drops before anyone knows why.
Too Many Screens
Hundreds of sensor readings sit in separate control rooms that nobody sees together.
Safety Slips
Hard hats get skipped and people walk into high-voltage areas without anyone seeing.
Remote Assets
Far-off substations need regular checks, and sending people out every time costs a lot.
Compliance Reports
Emissions and compliance reports get built by hand from logs, month after month.
Sound familiar? Here’s what changes.
Sound familiar? Here’s what changes.
Sound familiar? Here’s what changes.
Fewer surprises, from the plant to the substation.
Fewer surprises, from the plant to the substation.
Fewer surprises, from the plant to the substation.
Before
Before
Before
- Outages that start as a quiet warning sign.
- Outages that start as a quiet warning sign.
- Outages that start as a quiet warning sign.
- Belt damage found after the boilers run short.
- Belt damage found after the boilers run short.
- Belt damage found after the boilers run short.
- Readings spread across many screens.
- Readings spread across many screens.
- Readings spread across many screens.
- Safety checked only when someone is around.
- Safety checked only when someone is around.
- Safety checked only when someone is around.
- A site visit for every routine check.
- A site visit for every routine check.
- A site visit for every routine check.
- Reports built by hand every month.
- Reports built by hand every month.
- Reports built by hand every month.
After
>Early signs flagged before they become outages.
>A camera spots scrap and stops the belt in time.
>Every reading on one screen in the browser.
>Missing gear and unsafe entries flagged live.
>Cameras and sensors check in for you.
>Reports that pull from your data on their own.
SOLUTIONS USED
SOLUTIONS USED
SOLUTIONS USED
Predictive Maintenance
Predictive Maintenance
Predictive Maintenance
Conveyor Belt Monitoring
Conveyor Belt Monitoring
Conveyor Belt Monitoring
Plant Monitoring
Plant Monitoring
Plant Monitoring
Video Analytics and Safety
Video Analytics and Safety
Video Analytics and Safety
Computer Vision
Computer Vision
Computer Vision
Process Automation
Process Automation
Process Automation
Data & Analytics
Data & Analytics
Data & Analytics
249 parameters, about 500 tags a second, live
249 parameters, about 500 tags a second, live
249 parameters, about 500 tags a second, live
How it runs on site
How it runs on site
How it runs on site
Runs on a server inside your plant
Runs on a server inside your plant
Runs on a server inside your plant
Keeps working when the internet doesn't
Keeps working when the internet doesn't
Keeps working when the internet doesn't
OUR CAPABILITIES
OUR CAPABILITIES
OUR CAPABILITIES
What makes our solutions work




WHY CHOOSE US
WHY CHOOSE US
WHY CHOOSE US
Why Trust KGT Solutions With
Why Trust KGT Solutions With
Why Trust KGT Solutions With
Energy & Utilities
Energy & Utilities
Energy & Utilities
Solutions
Solutions
Solutions
Our plant monitoring already runs live across two plants, including a power plant, handling 249 parameters at about 500 tags a second.
Our plant monitoring already runs live across two plants, including a power plant, handling 249 parameters at about 500 tags a second.
Our plant monitoring already runs live across two plants, including a power plant, handling 249 parameters at about 500 tags a second.
It runs on a server inside your plant and keeps working when the internet doesn't. The engineers who set it up stay on to support it.
It runs on a server inside your plant and keeps working when the internet doesn't. The engineers who set it up stay on to support it.
It runs on a server inside your plant and keeps working when the internet doesn't. The engineers who set it up stay on to support it.
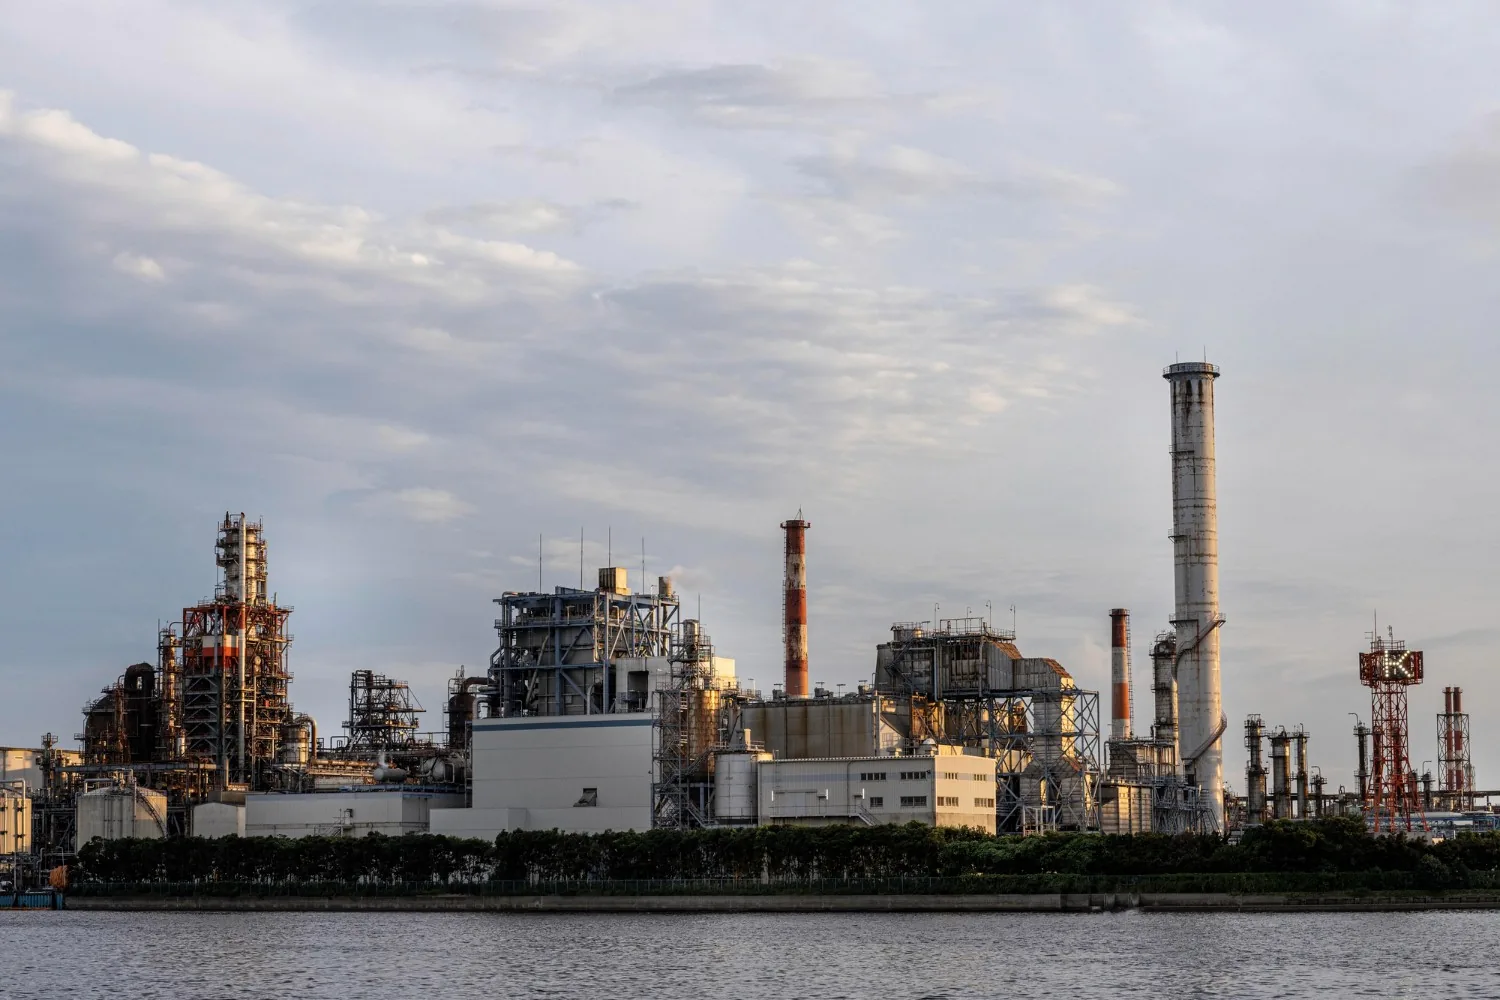
Deployed in Live Operations • Power plant
Deployed in Live Operations • Power plant
Deployed in Live Operations • Power plant
Hundreds of Sensors, Many Screens. One Live View Since Go-Live.
Hundreds of Sensors, Many Screens. One Live View Since Go-Live.
Hundreds of Sensors, Many Screens. One Live View Since Go-Live.


We built Plant Monitoring
We built Plant Monitoring
We built Plant Monitoring
Every sensor reading in the plant streams into one browser screen, and it keeps working even when the internet connection drops.
Every sensor reading in the plant streams into one browser screen, and it keeps working even when the internet connection drops.
Every sensor reading in the plant streams into one browser screen, and it keeps working even when the internet connection drops.
Tags read every second
Tags read every second
Tags read every second
~500
~500
~500
Parameters on one screen
Parameters on one screen
Parameters on one screen
249
249
249
Internet needed to keep running
Internet needed to keep running
Internet needed to keep running
None
None
None
Industrial AI System
Industrial AI System
Industrial AI System
IIoT
IIoT
IIoT
Plant Monitoring
Plant Monitoring
Plant Monitoring
On-site Server
On-site Server
On-site Server
Data & Analytics
Data & Analytics
Data & Analytics
Frequently Asked Questions
Frequently Asked Questions
Frequently Asked Questions
Didn’t see yours? Ask us and we’ll get back to you.
Didn’t see yours? Ask us and we’ll get back to you.
Didn’t see yours? Ask us and we’ll get back to you.